1. top command
The top command gives real-time information about the running processes as well as a summary of system information. It displays uptime, load averages, CPU states, memory usage, and tasks i.e. total, running, sleeping, stopped, and zombie tasks.
It also displays a list of real-time running processes with all the details. To run the top command, execute the following command in a terminal window:
top |
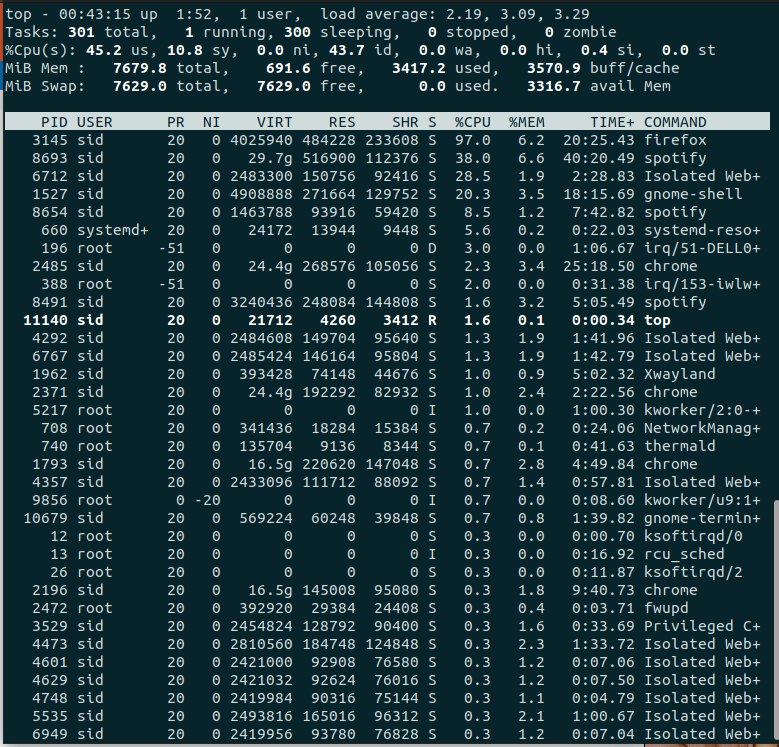
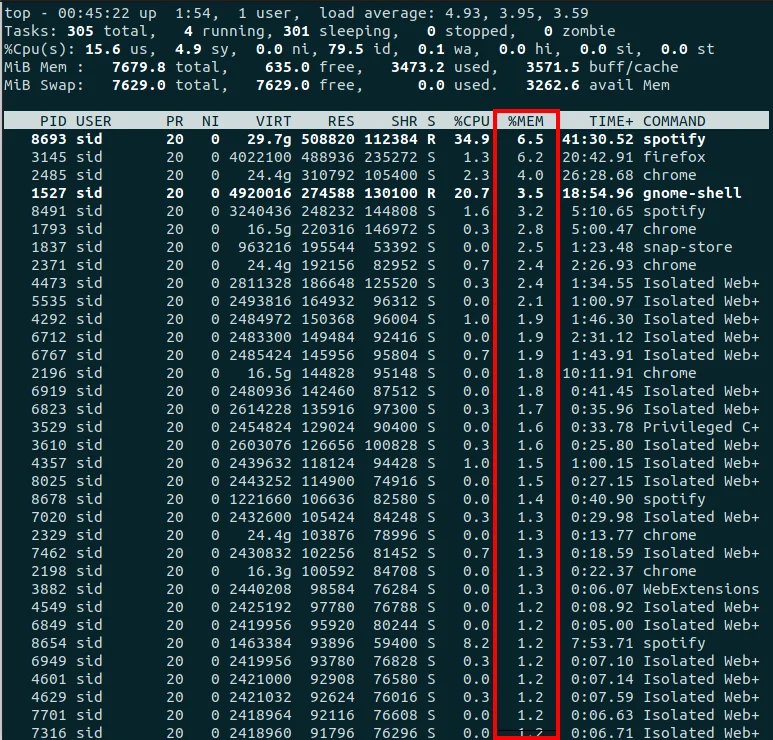
To sort the processes by memory usage, Execute the following command:
top -o %MEM |
2. ps command
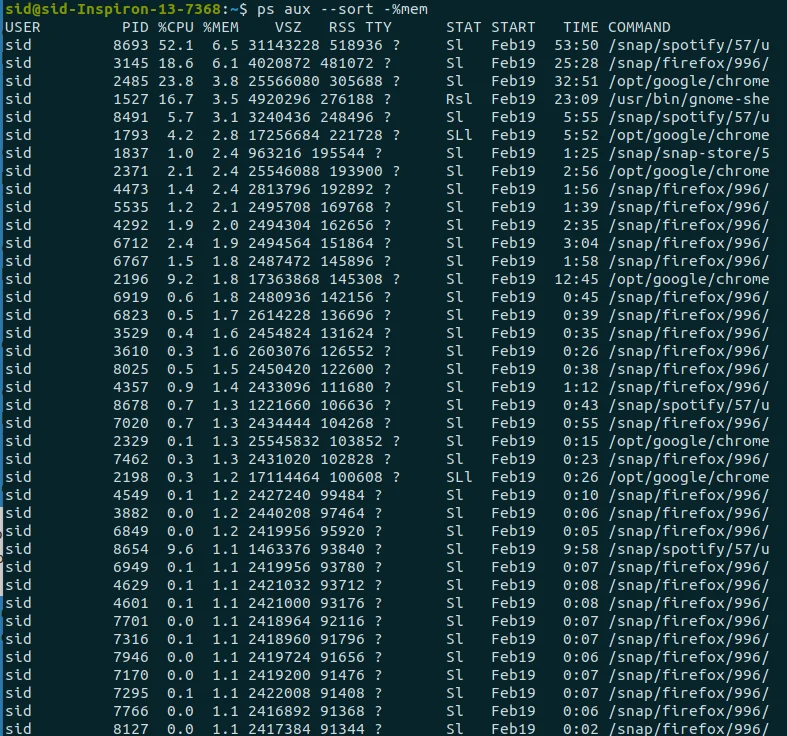
Unlike top command, which repeatedly displays a list of processes repeatedly, the ps command displays a snapshot of active processes i.e. it does not display the updated information continuously. To run ps command sorted by memory in descending order, Execute the following command:
ps aux --sort -%mem |
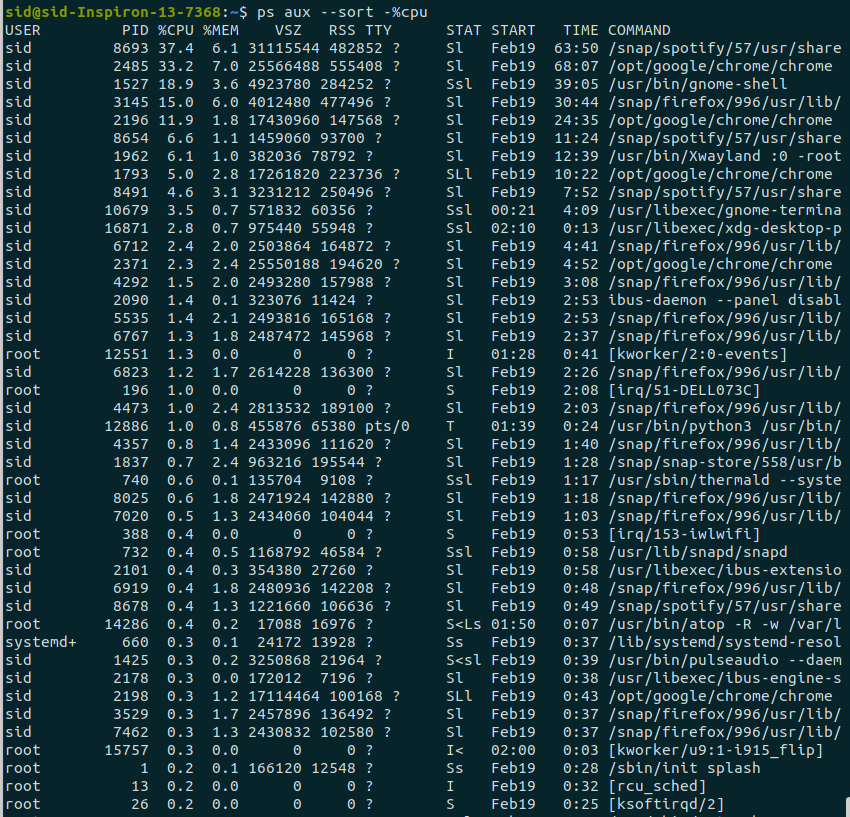
To sort by cpu, Replace the %mem by %cpu in the above command:
ps aux --sort -%cpu |
To limit the number of processes using head command, Change the above command as shown:
ps aux --sort -%mem | head-15 |

To list only specific information about the processes sorted by memory, Execute the following command:
ps -eo pid,%cpu,%mem,cmd --sort -%mem |

3. glances command
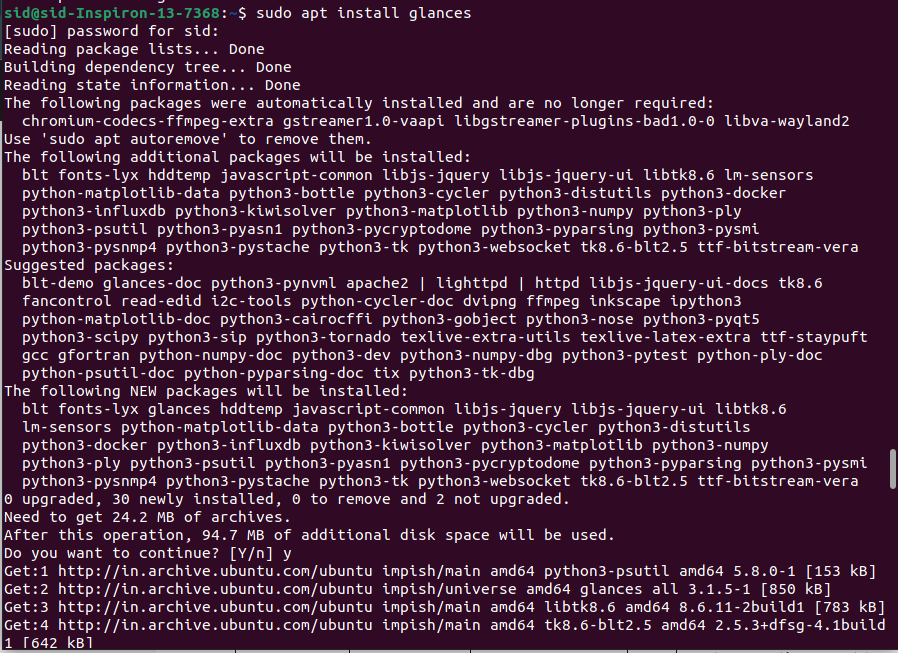
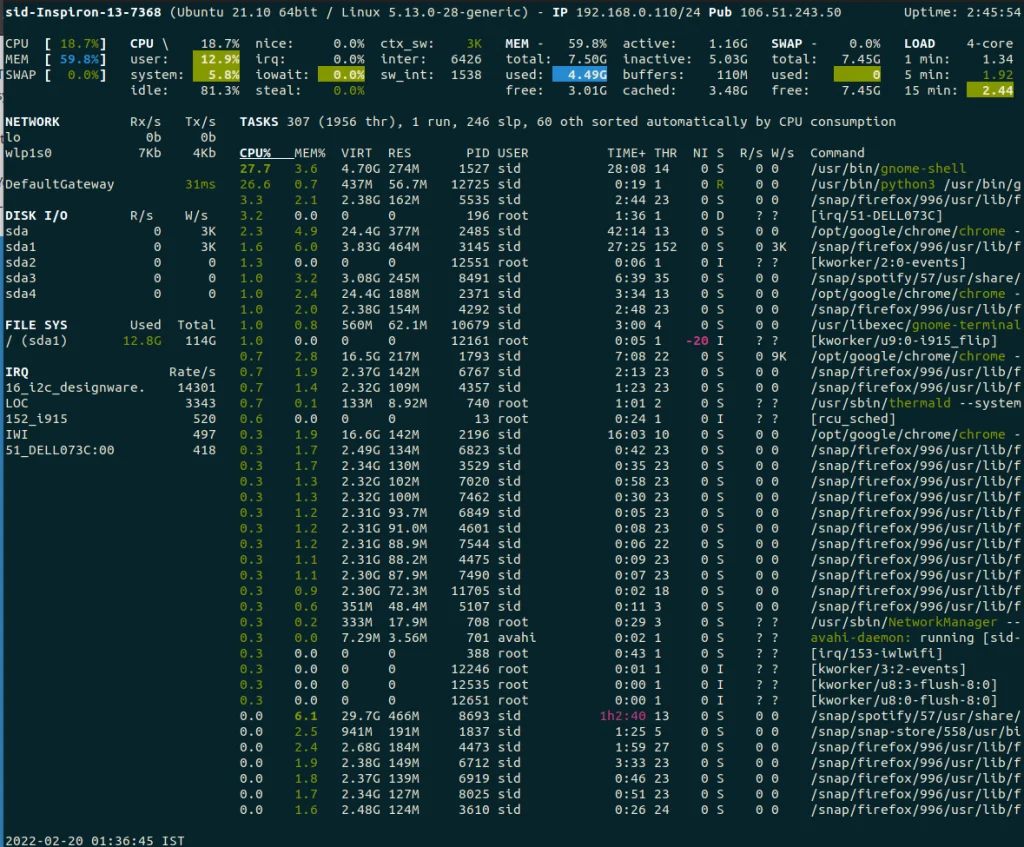
glances is a monitoring tool that provides maximum information in minimum space. It is written in Python and can also be used for server monitoring and remote monitoring. To install glances, Execute the following command in a terminal window:
sudo apt install glances |
Run the glances command:
glances |
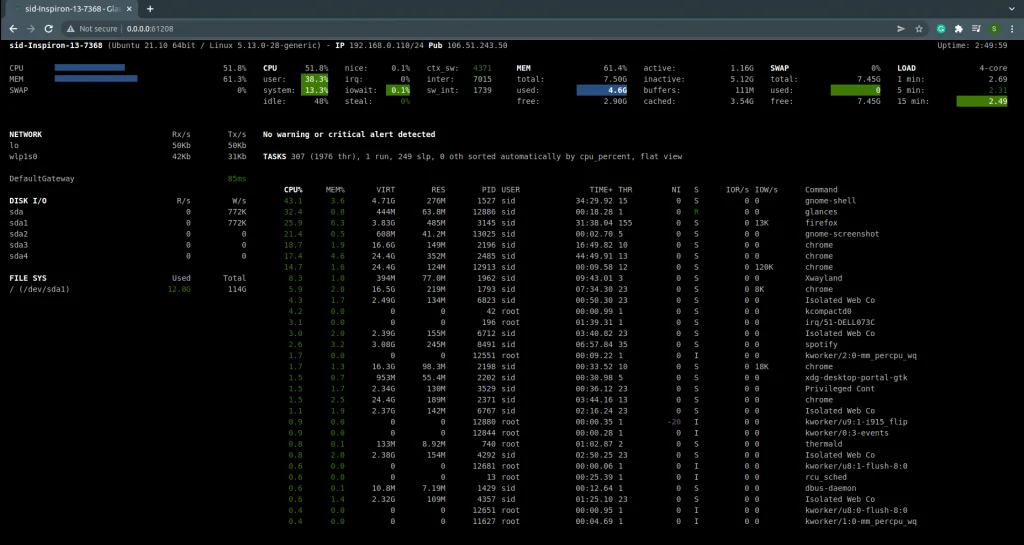
To monitor the system using a web user interface( web UI), enter the following command:
glances -w |

Right-click on the given address and open it in the browser.
4. htop and atop command
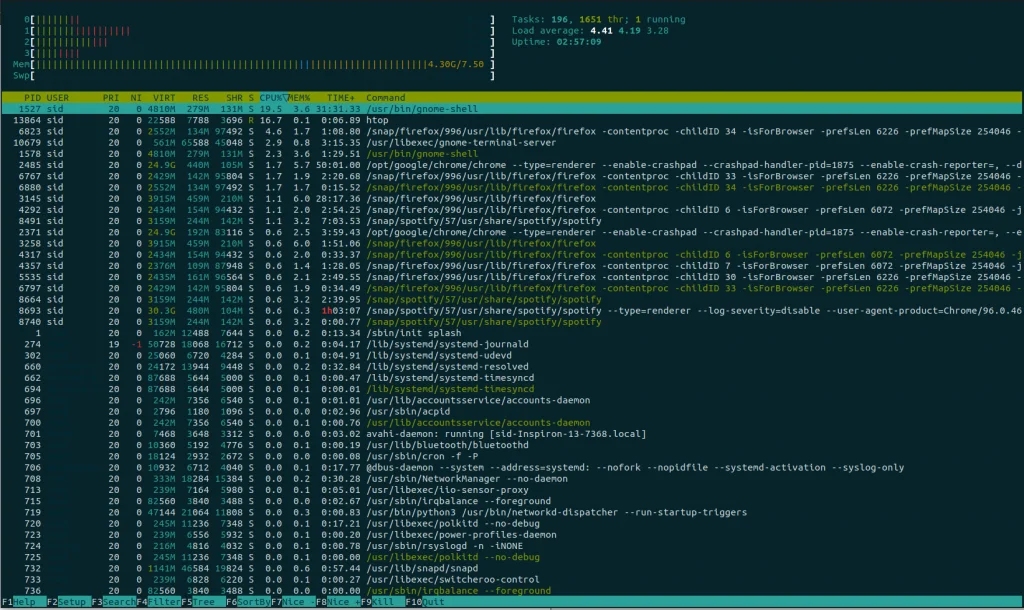
Though it is similar to the glances command, htop command provides you with more information in a colorful display. To install htop command, Run the following command:
sudo apt install htop |

Run the htop command:
htop |
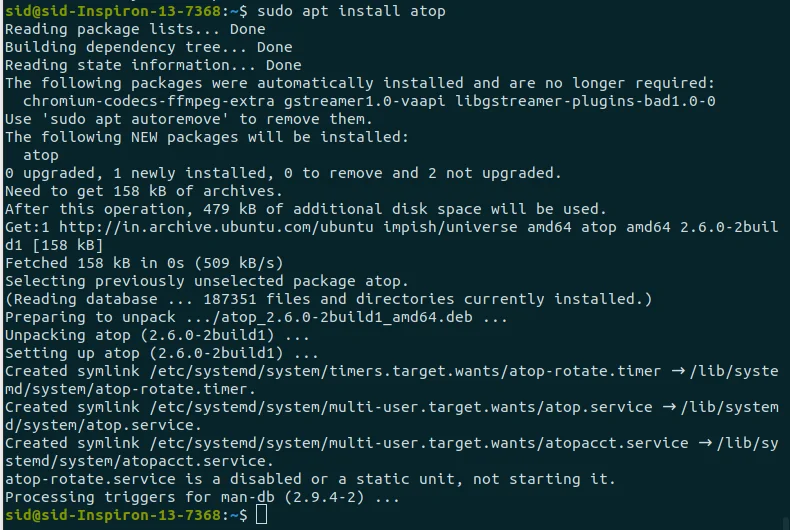
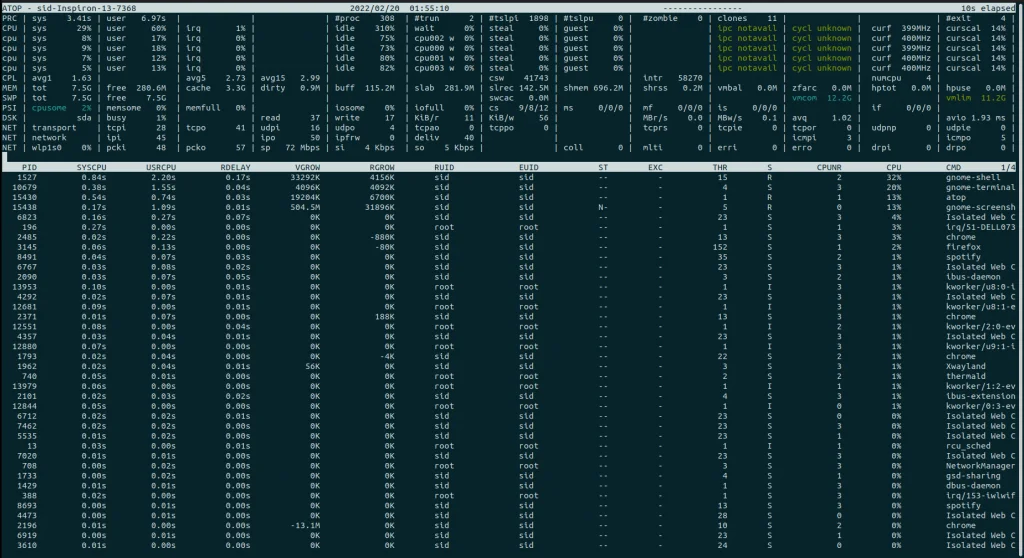
Similarly, atop command also displays the system information in a more interactive way, It can also store the output in a file. To install atop, Run the following command:
sudo apt install atop |
Run the atop command:
atop |
5. nmon command
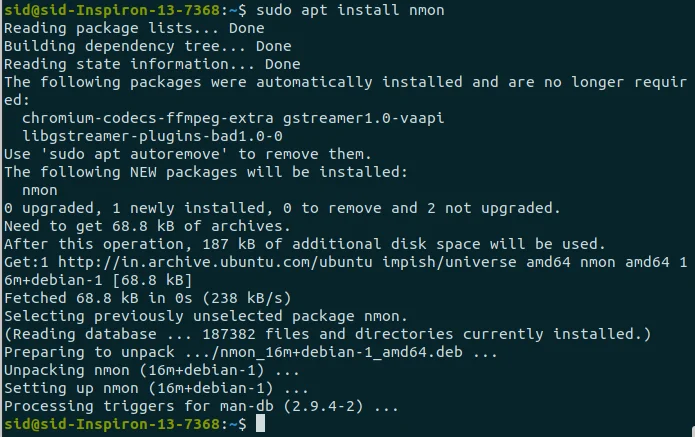
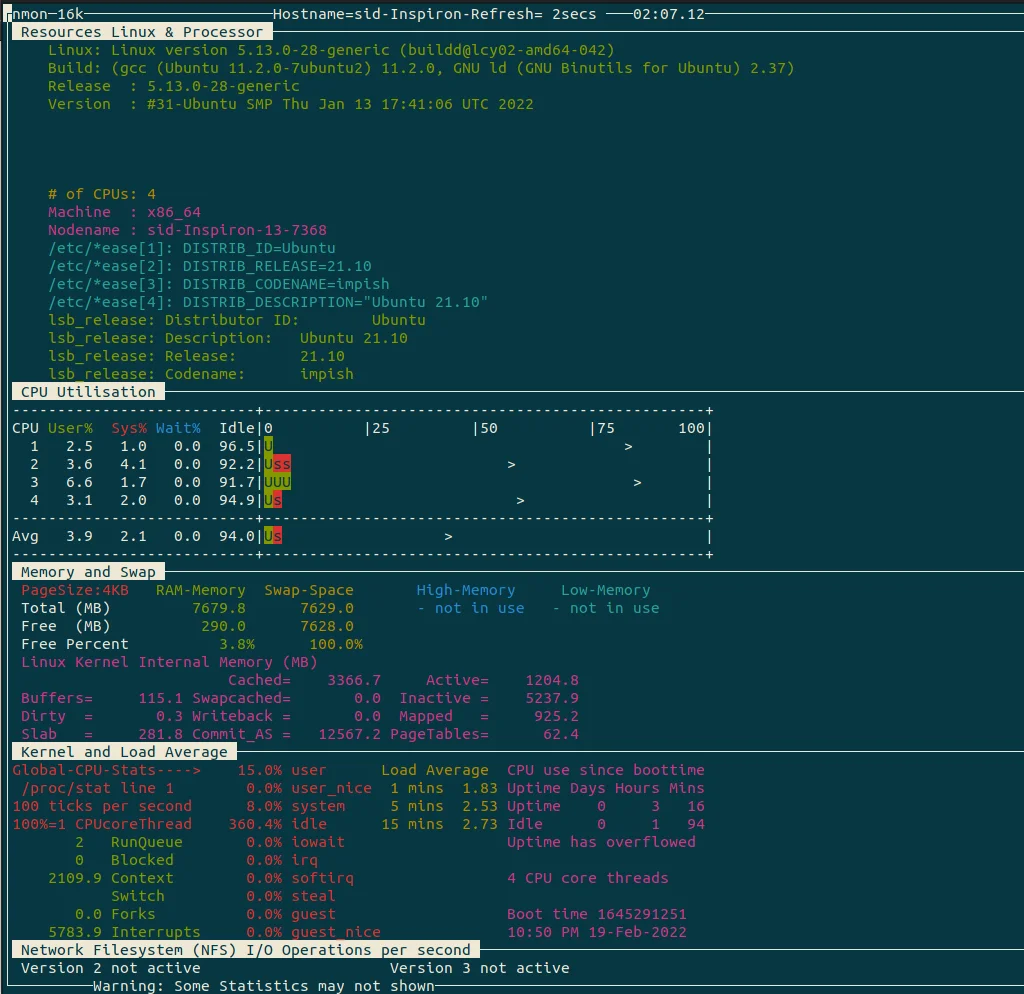
nmon is another monitoring tool that displays all information such as CPU, memory, DIsks, network, kernel, NFS, top processes and resources. To install nmon command, Run the following command:
sudo apt install nmon |
Run the nmon command:
nmon |
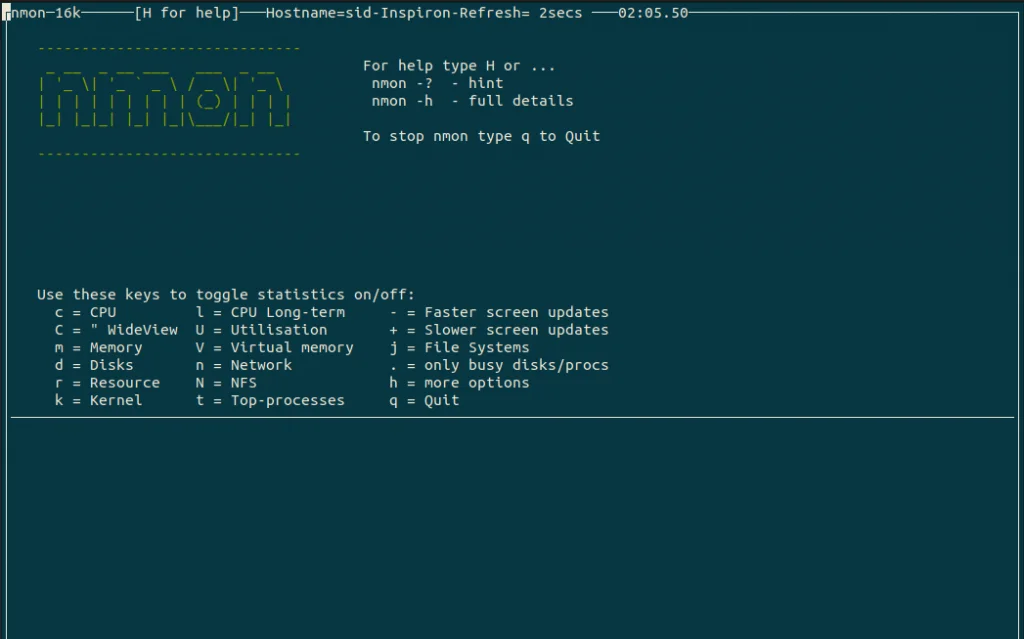
Press the appropriate keywords as per your needs. Here, It displays the CPU, memory, Disks, resources, kernel, and network information. To find the top running processes, Press t.
Conclusion
So, We discussed How to find the top running processes by memory and CPU. All the commands almost work similar, only the interface and some information are different. Thank you for reading!
credit: https://www.linuxfordevices.com/tutorials/linux/find-top-running-processes
