At Amplitude, our goal is to provide easy-to-use interactive product analytics, so everyone can find answers to their product questions. In order to provide a great user experience, Amplitude needs to provide these answers quickly. So when one of our customers complained about how long it took to load the event properties dropdown in the Amplitude UI, we started digging into it.
By tracking latency at different levels we figured one particular PostgreSQL query was taking 20 sec to finish. This was a surprise for us, as both tables have indexes on the joined column.

The PostgreSQL execution plan for this query was unexpected. Even though both tables have Indexes, PostgreSQL decided to do a Hash Join with a sequential scan on the large table. The sequential scan on a large table contributed to most of the query time.

I initially suspected it could be due to fragmentation. But after inspecting the data, I realized this table was append only and there weren’t many deletions happening on this table. Since reclaiming space using vacuum is not going help much here, I started exploring more. Next, I tried the same query on another customer with good response times. To my surprise the query execution plan looked completely different!

Interestingly, app A only accessed 10x more data than app B, but the response time was 3000x longer.
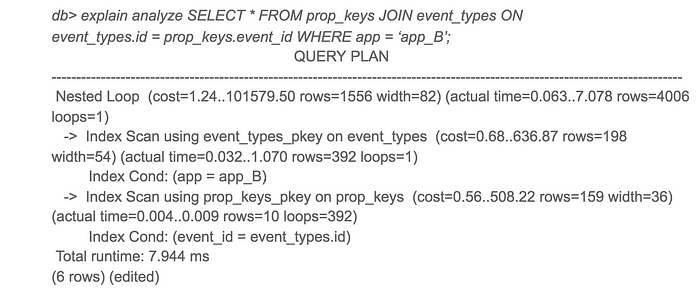
To see the alternative query plans PostgreSQL considered before picking Hash Join, I disabled hash join and reran the query.

There you go! The same query finished 50x faster when using a Nested Loop instead of a Hash Join. So why did PostgreSQL choose a worse plan for app A?
Looking more closely at the estimated cost and actual run time for both plans, estimated cost to actual runtime ratios were very different. The main culprit for this discrepancy was the sequential scan cost estimation. PostgreSQL estimated that a sequential scan would be better than 4000+ index scans, but in reality index scans were 50x faster.
That led me to the ‘random_page_cost’ and ‘seq_page_cost’ configuration options. The default PostgreSQL values of 4 and 1 for ‘random_page_cost’, ‘seq_page_cost’ respectively are tuned for HDD, where random access to disk is more expensive than sequential access. However these costs were inaccurate for our deployment using gp2 EBS volume, which are solid state drives. For our deployment random and sequential access is almost the same.
I changed ‘random_page_cost’ to 1 and retried the query. This time, PostgreSQL used a Nested Loop and the query finished 50x faster. After the change we also noticed a significant drop in max response times from PostgreSQL.

If you are using SSDs and running PostgreSQL with default configuration, I encourage you to try tuning random_page_cost & seq_page_cost. You might be surprised by some huge performance improvements.
Has any other parameter tuning given you huge gains across the board? Let us know about it in the comments.
resource: https://amplitude.engineering/how-a-single-postgresql-config-change-improved-slow-query-performance-by-50x-85593b8991b0
