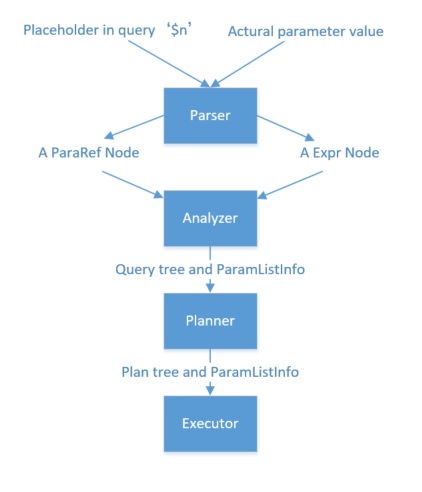
custom vs. generic plans
With my Oracle database background, I know how important it is to balance the pros and cons of using bind variables (parameterized queries) vs. literals.
- Bind variables have the advantage to share the query execution plan with several executions so that there’s no need to compile the SQL statement (parse and optimize) each time
- Bind variables have the inconvenient to share the query execution plan with the risk that what is optimized for one value is bad for another set of values
This post is about PostgreSQL prepared statements that contain parameters, showing when the execution plan is optimized for those parameter values. For people with an Oracle experience, I start to quickly explain the Oracle database behavior in order to emphasize the difference. Basically, there are two possibilities. The plan can be compiled without any knowledge of the values for which it will be executed. Or the plan can be optimized for a chosen fixed value (called peeked bind in Oracle or sniffed parameter in SQL Server, or custom plan in PostgreSQL).
Oracle
Until Oracle 9iR2 the execution plan was optimized before any binding or execution. From 9iR2, except when “ _optim_peek_user_binds” is set false, the optimization is deferred to the first execution and the plan will be optimized for it. It is then expected to have better estimations, especially with histogram statistics. But the future executions of the same cursor will re-use the same plan, and that can be bad if the data distribution is different for those values. In 11g, Oracle tried to prevent this in some cases where the optimizer can decide to optimize it again with the new execution value (Adaptive Cursor Sharing). But that is about cursor sharing and the goal of this post is to compare with PostgreSQL which has no cursor sharing. The only way to share a cursor for multiple executions is by preparing it — and the limitation is that it can be shared in the same session only: there is no shared pool in PostgreSQL.
PostgreSQL
With PostgreSQL, there is nothing like Oracle cursor sharing to avoid the expensive compilation at each execution. Trying to avoid that requires to prepare the statements. But even there, there is no immediate re-use of the execution plan:
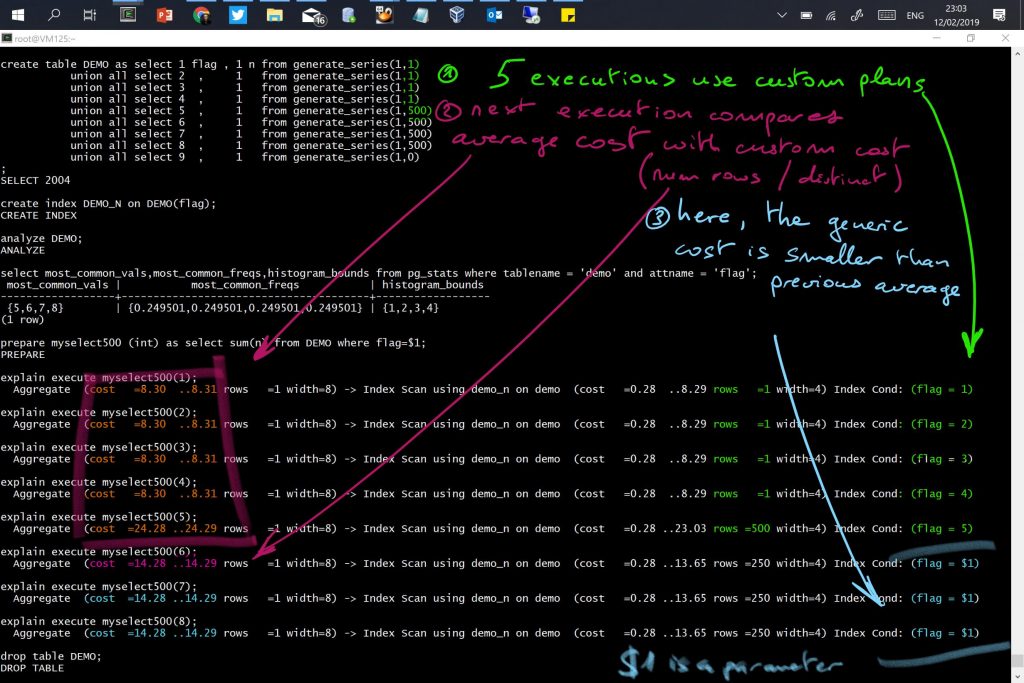
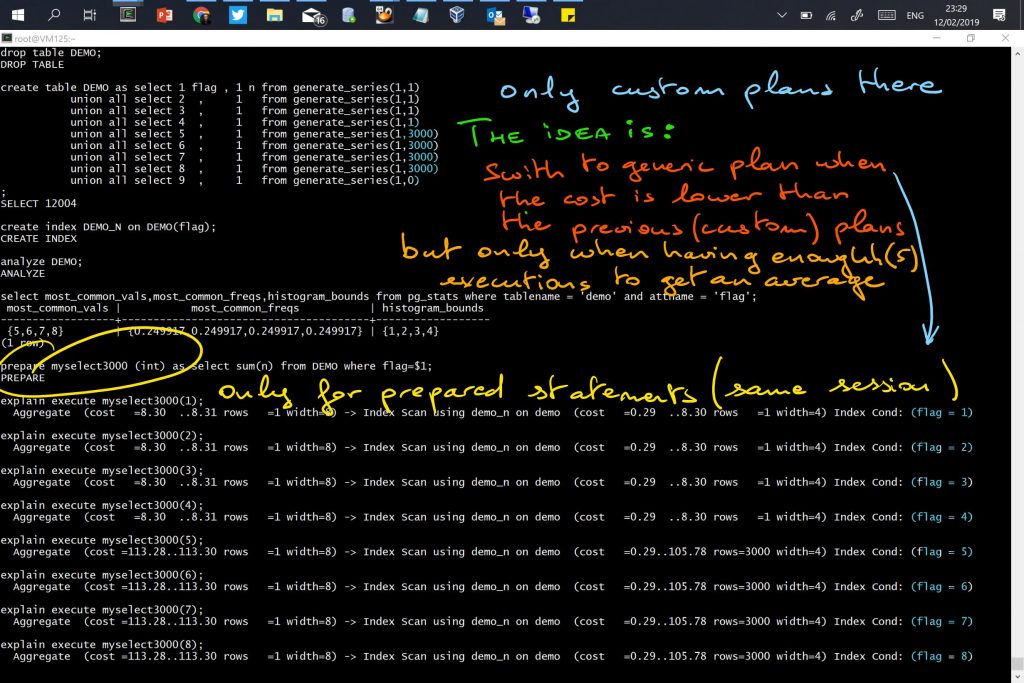
- The first 5 executions will compile the query plan for each execution — aiming at an accurate plan as if the values were passed as literals.
- From the 6th execution, a generic plan can be reused by all future executions of the same prepared statement (in the same session). But no ‘peeked bind’ is chosen. The optimizer chooses a plan optimized without the knowledge of the parameter values.
This runs with the following table created and analyzed:
create table DEMO as select 1 n from generate_series(1,11)
           union all select 2   from generate_series(1,22)
           union all select 3   from generate_series(1,33)
           union all select 4   from generate_series(1,44)
           union all select 5   from generate_series(1,55)
           union all select 6   from generate_series(1,66)
           union all select 7   from generate_series(1,77)
           union all select 8   from generate_series(1,88)
           ;select count(*),count(distinct n) from DEMO;

 count | count
-------+-------
   396 |     8

analyze DEMO;
ANALYZE
I’ve created rows with skewed distributions: 11 rows with value ‘1’, 22 rows with value ‘2’,… up to 88 rows with value ‘8’. And I analyzed the table so that histograms are gathered to have the query planner aware of it:
\x
Expanded display is on.
select * from pg_stats where tablename = 'demo' and attname = 'n';
-[ RECORD 1 ]----------+------------------------------------------
schemaname             | public
tablename              | demo
attname                | n
inherited              | f
null_frac              | 0
avg_width              | 4
n_distinct             | 8
most_common_vals       | {8,7,6,5,4,3,2,1}
most_common_freqs      | {0.2222,0.1944,0.1667,0.1389,0.1111,0.08333,0.05556,0.02778}
histogram_bounds       |
correlation            | 1
most_common_elems      |
most_common_elem_freqs |
elem_count_histogram   |

\x
Expanded display is off.
No surprises. I have 396 rows, then the 88 rows with value ‘8’ have a density of 88/396=0.222 and so on.
I prepare my statement:
prepare myselect (int) as select count(*) from DEMO where n=$1;
PREPARE
And run this statement several times with different values, the goal being to look at the query planner estimation for the number of rows, for each execution:
postgres=# explain execute myselect(1);
                        QUERY PLAN
-----------------------------------------------------------
 Aggregate  (cost=6.98..6.99 rows=1 width=8)
   ->  Seq Scan on demo  (cost=0.00..6.95 rows=11 width=0)
         Filter: (n = 1)

postgres=# explain execute myselect(2);
                        QUERY PLAN
-----------------------------------------------------------
 Aggregate  (cost=7.00..7.01 rows=1 width=8)
   ->  Seq Scan on demo  (cost=0.00..6.95 rows=22 width=0)
         Filter: (n = 2)

postgres=# explain execute myselect(3);
                        QUERY PLAN
-----------------------------------------------------------
 Aggregate  (cost=7.03..7.04 rows=1 width=8)
   ->  Seq Scan on demo  (cost=0.00..6.95 rows=33 width=0)
         Filter: (n = 3)

postgres=# explain execute myselect(4);
                        QUERY PLAN
-----------------------------------------------------------
 Aggregate  (cost=7.06..7.07 rows=1 width=8)
   ->  Seq Scan on demo  (cost=0.00..6.95 rows=44 width=0)
         Filter: (n = 4)

postgres=# explain execute myselect(5);
                        QUERY PLAN
-----------------------------------------------------------
 Aggregate  (cost=7.09..7.10 rows=1 width=8)
   ->  Seq Scan on demo  (cost=0.00..6.95 rows=55 width=0)
         Filter: (n = 5)

postgres=# explain execute myselect(6);
                        QUERY PLAN
-----------------------------------------------------------
 Aggregate  (cost=7.08..7.08 rows=1 width=8)
   ->  Seq Scan on demo  (cost=0.00..6.95 rows=50 width=0)
         Filter: (n = $1)

postgres=# explain execute myselect(7);
                        QUERY PLAN
-----------------------------------------------------------
 Aggregate  (cost=7.08..7.08 rows=1 width=8)
   ->  Seq Scan on demo  (cost=0.00..6.95 rows=50 width=0)
         Filter: (n = $1)

postgres=# explain execute myselect(8);
                        QUERY PLAN
-----------------------------------------------------------
 Aggregate  (cost=7.08..7.08 rows=1 width=8)
   ->  Seq Scan on demo  (cost=0.00..6.95 rows=50 width=0)
         Filter: (n = $1)
As documented, the first 5 executions used a custom plan, getting the estimations from the parameter value. The estimation is exact (11,22,33,44,55) because I have frequency histograms for those values. But starting with the 6th execution, a generic plan was used to avoid to parse at each execution. This plan does not look at the parameter values (we see “$1” in the filter predicate) and does not re-use any of the previous plans. It is estimated with an average selectivity as if there were no histograms. Here the estimation (rows=50) comes from the average number of rows:
select count(n),count(distinct n),
 count(n)::numeric/count(distinct n) "avg rows per value" from DEMO;

count | count | avg rows per value
-------+-------+---------------------
   396 |     8 | 49.5000000000000000
Cost decision for generic plan vs. custom plan
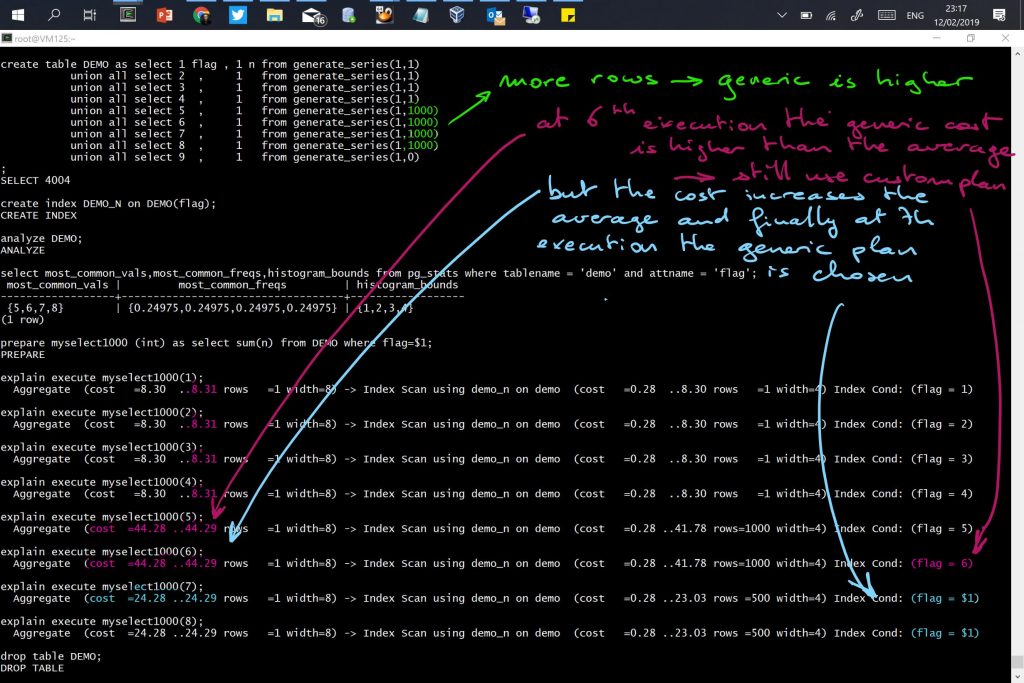
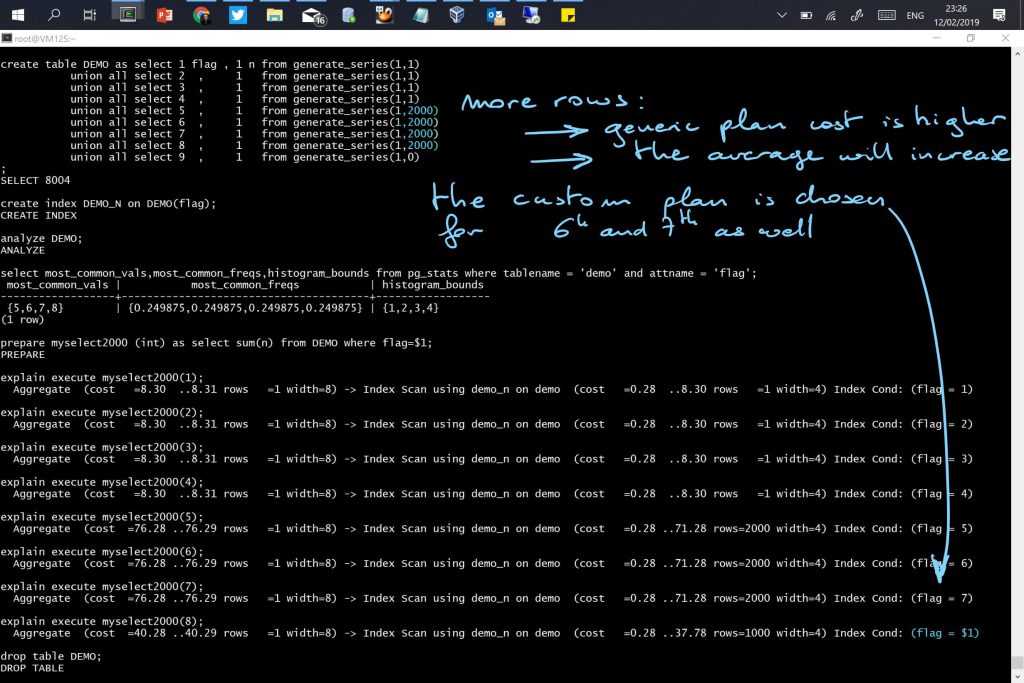
The documentation mentions that the cost of the generic plan is compared to the average of the custom plans.
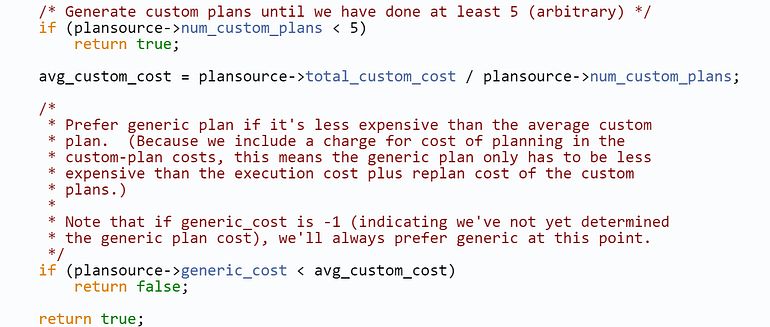
This is to avoid that a generic plan is more expensive, as it would be better to spend additional parse time for a custom plan. Besides the documentation, this is “arbitrary” 5 executions and the average custom cost are mentioned in plancache.c
Here is another example with a partitioned table. Partition pruning can occur at parse time or execution time. But when the partition is not known at parse time, the query planner estimates the cost and cardinality without partition pruning.
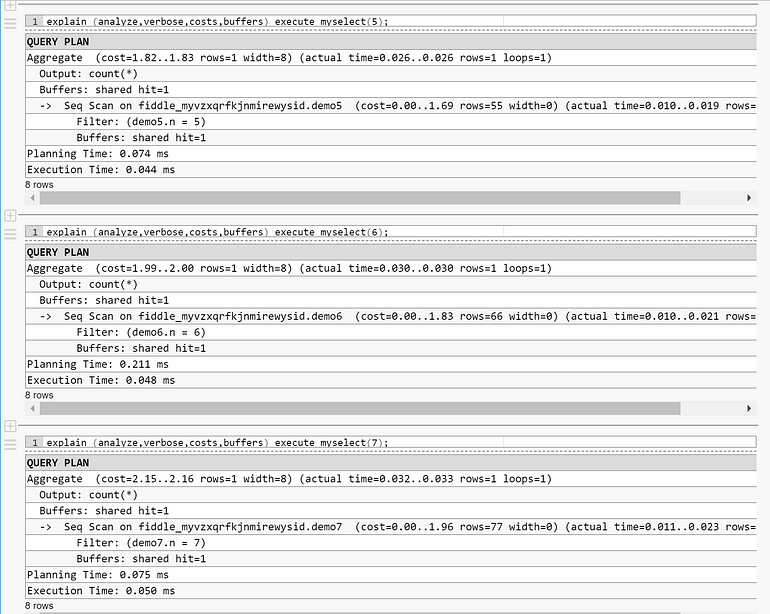
The query planner continues with the custom plan even after the 5th execution because the cost of the generic plan, estimated on the whole table, is higher than the custom plan, even including the parse time.
Forcing generic plan
In order to show the cost of the generic plan, I’ve run it on PostgreSQL 12 where we can control the custom vs. generic choice with PLAN_CACHE_MODE. The default is AUTO (the behavior described above) but we can also set it to FORCE_CUSTOM_PLAN or FORCE_GENERIC_PLAN.
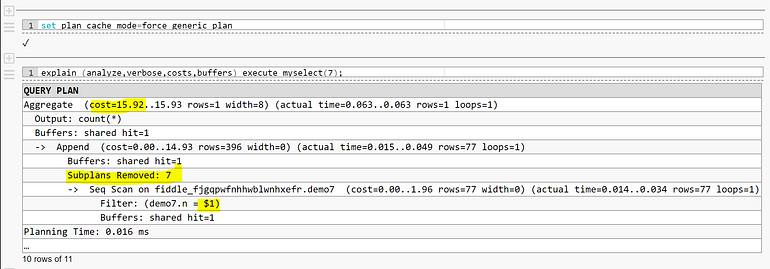
The filter is parameterized, but only DEMO7 has been read. The “Subplans Removed” is the execution-time partition pruning. However, the cost and cardinality did no estimations for this: (rows=396) is the total number of rows. And for this reason, the AUTO plan cache mode did not choose it because it is much higher than the average cost of the custom plans encountered before. I would have preferred that the query planner estimates an average cost for partition pruning rather than ignoring it for the generic plan cost estimation, because it knows, from the table definition, that only a single partition needs to be read, even if it doesn’t know which one yet.
Forcing custom plan
Back to the non-partitioned table from the first example in this post, where the generic plan was chosen after the 5th execution, I force the custom plan

set plan_cache_mode=force_custom_plan
This forces the custom plan even after the 5th execution.
Plan cache modes and Oracle equivalents
In PostgreSQL 12 which is still in beta, but will be released soon for production, we have now three choices:
- Use a custom plan, like when using literals, but with the advantages of parameters (to avoid SQL injection for example). Perfect for ad-hoc queries. There is no easy equivalent in Oracle (I would love a hint to say: do not share this and find the best plan for these values).
- Use a generic plan, for high throughput performance (avoid to parse each execution) and stability (the plan will be always the same). This is the equivalent of the Oracle “ _optim_peek_user_binds”=false setting that is used often in old OLTP applications, or like when no histograms are gathered.
- The “auto” method (the only one before version 12) where a prepared statement starts with a custom plan but may switch to a generic one after several executions. Oracle has no equivalent for prepared statements which always use the plan determined by the first execution values.
Sharing execution plans across sessions, or not?
While there, I add a few thoughts about cursor sharing between sessions (although this post was about prepared statements within the same session).
- Most commercial databases I know (Oracle, DB2, SQL Server) have a shared statement cache to avoid that one session re-parses a SQL statement already parsed by another session recently. Like C or Java programs that are compiled once, and then the binary code is executed.
- And most open source databases I know (PostgreSQL, MySQL) do not share the execution plans across the sessions. Like Perl or Python, that are compiled when loaded, each time they are executed.
Both approaches have pros and cons:
- More memory space and latch management issues when shared
- More CPU time spent in parsing when all cursors are private
I think that there’s no bad or good approach, but it is related to their nature:
- Commercial databases have many optimizer transformations which increase the parsing time, in order to get acceptable response time even for very bad designed software where SQL cannot be changed (because it is a commercial application). Vendors have to please the customer who says “I cannot change the application code”. Hard parses must be rare to keep this scalable. And people care about the CPU consumption as it is the most common metric for licensing
- Open Source databases do not go to all those transformations. The answer to bad application design is to re-write the bad queries. That’s something an Open Source community can say, especially when the application itself is homemade or open source. There’s no commercial constraint to workaround this in the database, and parse time can be kept low. And on current hardware, there’s no problem to use more CPU when it avoids having to serialize the access to shared memory structures.
With my Oracle background, I tend to think that non-shared execution plans can be a limit for PostgreSQL evolution. We will see how the parse time will increase when dealing with complex joins, partitioning and parallel queries. But not sharing also solves many problems: my Oracle memories is full of fragmented shared pools, volatile data and bind peeking plan instabilities…
reference: https://franckpachot.medium.com/postgresql-bind-variable-peeking-fb4be4942252
