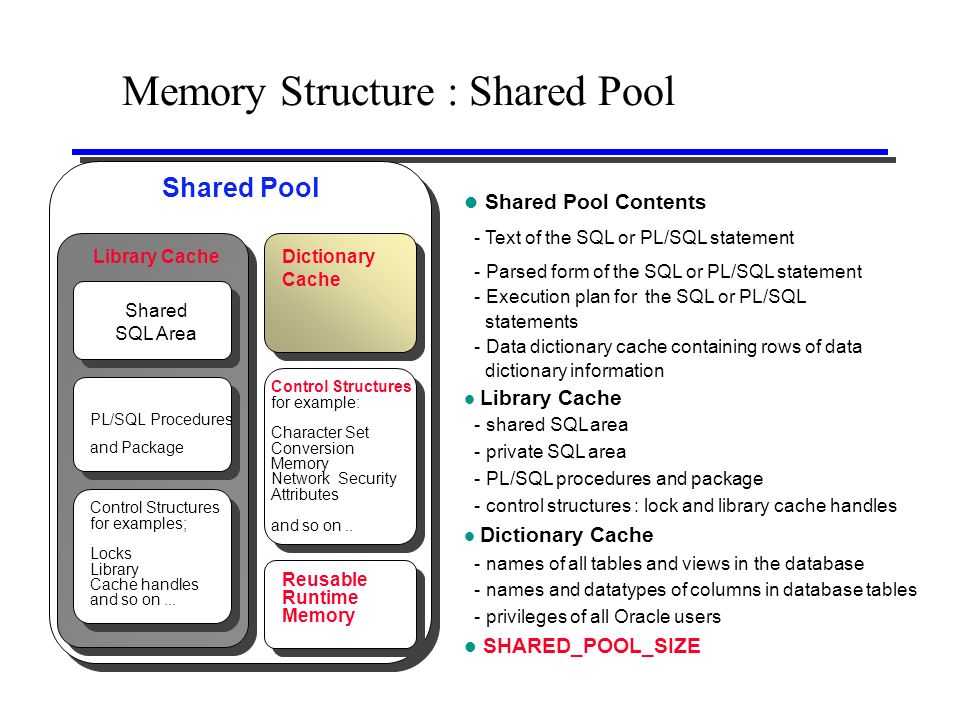
Add Space to shared pool
The library cache miss ratio tells the DBA whether or not to add space to the shared pool, and it represents the ratio of the sum of library cache reloads to the sum of pins. In general, if the library cache ratio is more than one, you should consider adding to the shared_pool_size.
Library Cache Misses
Library cache misses occur during the compilation of SQL statements. The compilation of a SQL statement consists of two phases:
- Parse phase: When the time comes to parse a SQL statement, Oracle first checks to see if the parsed representation of the statement already exists in the library cache. If not, Oracle will allocate a shared SQL area within the library cache and then parse the SQL statement
- Execute phase: At execution time, Oracle checks to see if a parsed representation of the SQL statement already exists in the library cache. If not, Oracle will re-parse and execute the statement.
Within the library cache, hit ratios can be determined for all dictionary objects that are loaded. If any of the hit ratios fall below 75 percent, you should add to the shared_pool_size. These include:
- Table/procedures
- Triggers
- Indices
- Package bodies
- Clusters
Library cache activity
The table V$LIBRARYCACHE is the V$ table that keeps information about library cache activity.
| Namespace | Indicates whether the measurement is for the SQL area, a table or procedure, a package body, or a trigger |
| Pins | Counts the number of times an item in the library cache is executed. |
| Reloads | Counts the number of times the parsed representation did not exist in the library cache, forcing Oracle to allocate the private SQL areas in order to parse and execute the statement |
View the code below to see an example oflibrary cache activity.
prompt         =========================
prompt         LIBRARY CACHE MISS RATIO
prompt         =========================
prompt (If > 1 then increase the shared_pool_size in init.ora)
prompt
column "LIBRARY CACHE MISS RATIO" format 99.9999
column "executions"    format 999,999,999
column "Cache misses while executing"    format 999,999,999

select sum(pins) "executions",sum(reloads) "Cache misses while executing",(((sum(reloads)/sum(pins)))) "LIBRARY CACHE MISS RATIO"
from V$librarycache;

=========================
LIBRARY CACHE MISS RATIO
=========================
(If > 1 then increase the shared_pool_size in init.ora)
  executions Cache misses while executing LIBRARY CACHE MISS RATIO
------------ ---------------------------- ------------------------
650,059       967                         .0015

prompt
prompt         =========================
prompt          Library Cache Section
prompt         =========================
prompt hit ratio should be > 70, and pin ratio > 70 ...
prompt

column "reloads" format 999,999,999

select namespace, trunc(gethitratio * 100) "Hit ratio",trunc(pinhitratio * 100) "pin hit ratio", reloads "reloads"
from V$librarycache;

=========================
Library Cache Section
=========================
hit ratio should be > 70, and pin ratio > 70 ...
NAMESPACE                                                         Hit ratio pin hit ratio    reloads
---------------------------------------------------------------- ---------- ------------- ----------
SQL AREA                                                                 98            91   22951294
TABLE/PROCEDURE                                                          97            73    6715705
BODY                                                                     99            99     143206
TRIGGER                                                                  99            99      62659
INDEX                                                                    98            97     110842
CLUSTER                                                                  99            99        470
PIPE                                                                     99            99        150
DIRECTORY                                                                98            98        293
QUEUE                                                                   100            99      22259
1) NAMESPACE 2) Hit ratio 3) pin hit ratio 4) reloads
- Indicates whether the measurement is for the SQL area, a table or procedure, a package body, or a trigger
- Hit Ratio
- Pin hit ratio column Text: The pin hit ratio, the number of times an SQL statement of PL/SQL block was accessed for execution in the library cache-is the most important part of the script. The higher the pin hit ratio, the more frequently Oracle found the SQL from the prior execution and did not need to re-parse the statement.
- This counts the number of times the parsed representation did not exist in the library cache, forcing Oracle to allocate the private SQL areas in order to parse and execute the statement.
Terms 1) library cache pin and 2) library cache lock
- library cache pin: This event manages library cache concurrency. Pinning an object causes the heaps to be loaded into memory. If a client wants to modify or examine the object, the client must acquire a pin after the lock.
- library cache lock: This event controls the concurrency between clients of the library cache. It acquires a lock on the object handle so that either:
- One client can prevent other clients from accessing the same object
- The client can maintain a dependency for a long time which does not allow another client to change the object
If the library cache miss ratio is >1 then a larger shared_pool_size may be appropriate. If any of the library cache hit ratios or pin hit ratios is less than 90percent, then an increase in shared_pool_size may be appropriate.
Parse calls
High parse calls indicate those SQL statements that cannot be re-used and must be re-parsed at each execution. You will want to inspect these SQL statements to see if they can be made reentrant by adding host variables.
prompt
**********************************************************
prompt SQL High parse calls prompt
**********************************************************
select substr(sql_text,1,60), parse_calls, executions from V$sqlarea
where parse_calls > 300 and executions < 2*parse_calls and executions > 1;

========================================

SUBSTR(SQL_TEXT,1,60)                                         PARSE_CALLS   EXECUTIONS
------------------------------------------------------------ ------------ ------------
select /*+ connect_by_filtering */ privilege#,level from sys  782,988,543  782,965,131
begin   if sys_context('USERENV', 'SESSION_USER') = 'BUYER_I  411,583,284  411,623,370
begin   if sys_context('USERENV', 'SESSION_USER') = 'KKU_LIS  411,579,405  411,622,168
begin   if sys_context('USERENV', 'SESSION_USER') = 'DAYAK'   205,800,245  205,811,121
begin   if sys_context('USERENV', 'SESSION_USER') = 'ONLINE_  205,789,175  205,810,072
begin   if sys_context('USERENV', 'SESSION_USER') = 'MSSMGR_  205,788,695  205,812,239
begin   if sys_context('USERENV', 'SESSION_USER') = 'REMOTE_  205,786,513  205,810,625
begin   if sys_context('USERENV', 'SESSION_USER') = 'MAP_APP  205,785,927  205,811,606
begin   if sys_context('USERENV', 'SESSION_USER') = 'BUYER_M  205,785,008  205,812,317
begin   if sys_context('USERENV', 'SESSION_USER') = 'CARTON_  205,784,264  205,809,458
begin   if sys_context('USERENV', 'SESSION_USER') = 'DC_RECE  205,783,215  205,811,400
In the listing above we will see all SQL statements that have a high number of parse calls. In an ideal world, an SQL statement should be parsed once and executed numerous times.
ref:https://www.relationaldbdesign.com/tuning-instance/module3/viewing-library-cache-statistics.php
